-
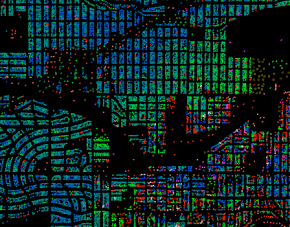
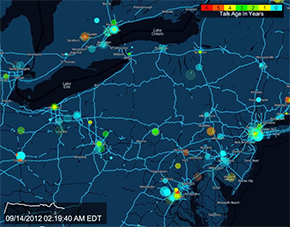
Visualizing the Ages of Portland, Oregon's Extant Buildings.
</br>
Secret Arts
-
Developed with Massive Pixel Environment, on one of the highest resolution tiled displays in the world.
</br>
Rob Turknett, Brandt Westing, Jason Baldridge, and Mike Speriosu. UT Austin
-
An animated visualization of Shanghai’s subway network.
</br>
Till Nagel and Benedikt Groß
-
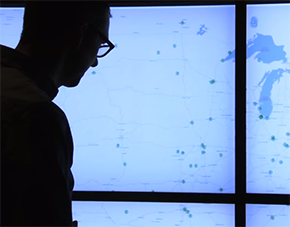
A visual map showing when and where US viewers watched TED talks.
</br>
Alex Dean, TED
-
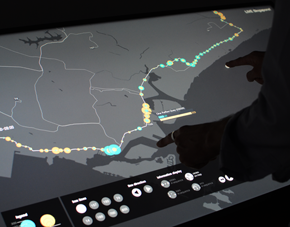
Visual exploration of urban mobility.
</br>
MIT Senseable City Labs
-
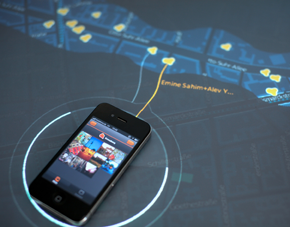
A tangible multitouch visualization to explore urban movement patterns, and to share engaging places with the help of a smartphone.
</br>
Pierre La Baume, Luis Grass, Christopher Pietsch, Gunnar Friedrich, David Ikuye
-
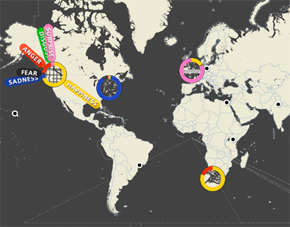
Discover patterns on how people feel in the world.
</br>
Daniel Palmér and Robin Rundkvist
-
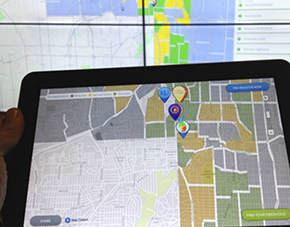
Port of Unfolding to use on Android tablet for Google Fiber campaign
</br>
Occurent Arts and Wildlife
-
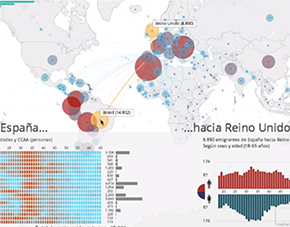
2nd place in International Challenge InnovaData
</br>
Xavi Gimenez
-
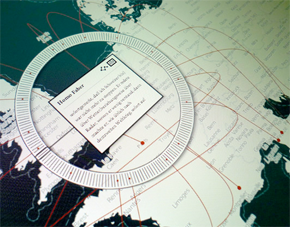
A tool for location based literary research.
</br>
Jan-Erik Stange and Sebastian Meier
-
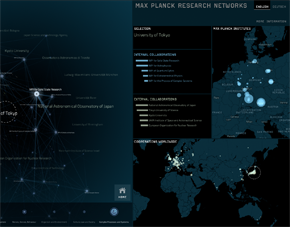
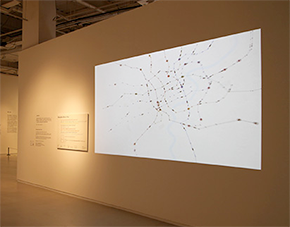
Multitouch installation showing how Max Planck institutes collaborate.
</br>
Moritz Stefaner and Onformative
-
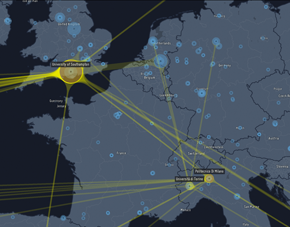
An interactive multitouch visualization of relations between geo-positioned locations.
</br>
Till Nagel
-
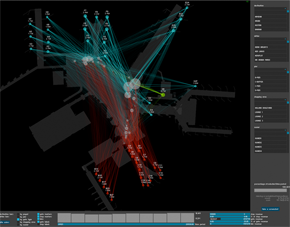
A tool for visual analysis of tax-free sales data at the Schiphol-Amsterdam airport
</br>
Jan Willem Tulp
-
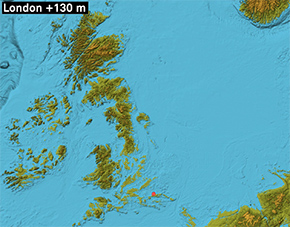
How the world would be reshaped by a monumental rise or decline of the sea level.
</br>
Benedikt Groß
-
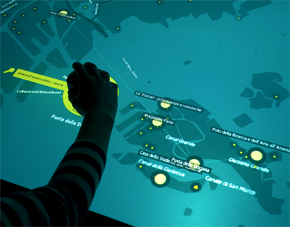
Tangible geo-visualization to explore architectural projects in Venice.
</br>
Interaction Design Lab, FH Potsdam
-
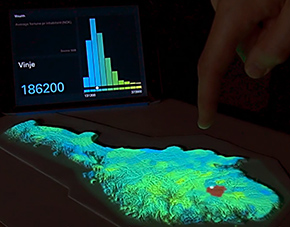
A physical platform for interactive data visualization on three-dimensional surfaces.
</br>
Jon Olav Eikenes